A case study

Managing earnings volatility using Credit Portfolio Management (CPM)
The top priority of the CPM usually is to understand the overall risk in the investment portfolio, maximize returns and manage credit concentration. One point which is often missed in the CPM discussions is that in the process of managing the risk concentration, the portfolio managers may also end up decreasing the earnings volatility. We emphasize this point by using a credit portfolio model applied to a stylized investment portfolio of EUR 50bn.
Case study
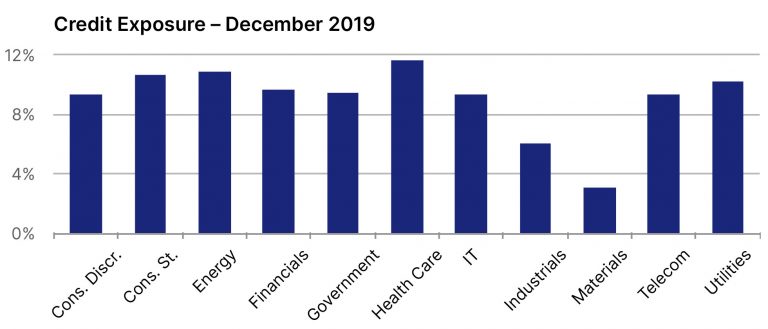
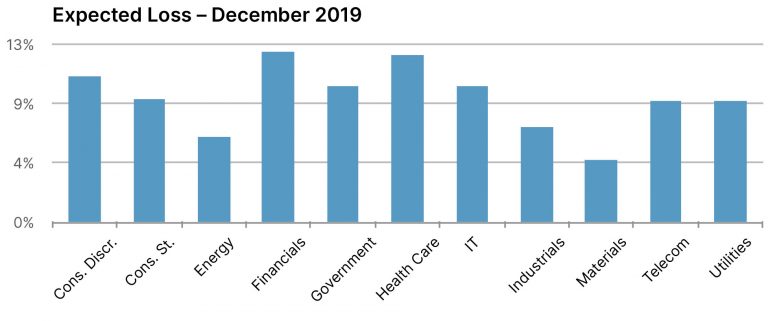
We start at the end of Q4 2019 with a portfolio without peak exposures by sector (see figure 2). We use a credit portfolio model to analyse the expected and unexpected losses (risk contribution) for credit migrations and defaults.
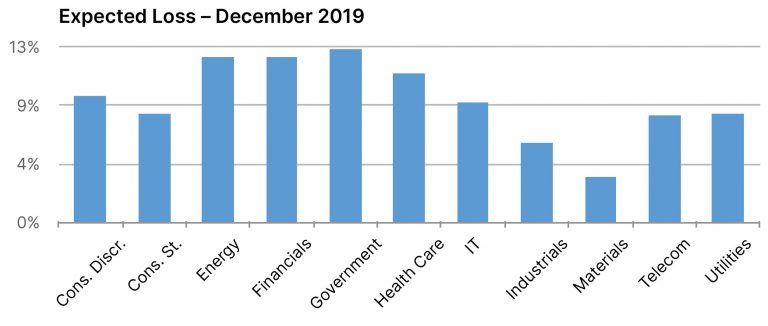
The credit portfolio model is calibrated towards a point-in-time setup: we use point-in-time default probabilities (calibrated with SigmaQ’s proprietary PD model, which covers 30’000+ corporates globally) for corporates/financial institutions and work with a blended (CDS spread implied PDs and rating implied PDs) 1-year default probability for government, federal, municipality and supranational exposures.
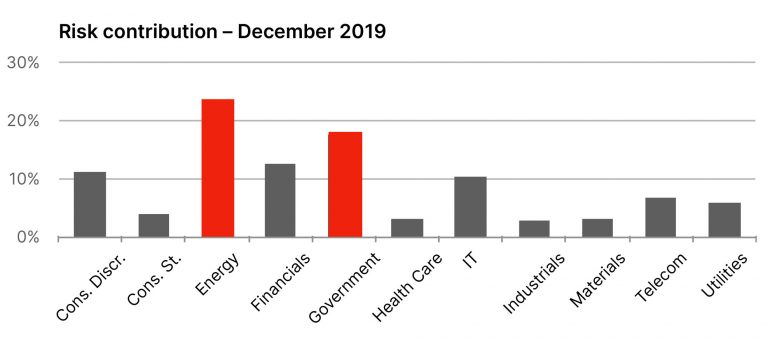
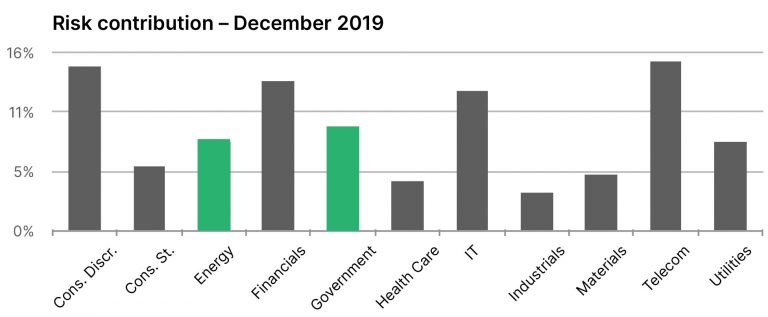
This picture changes substantially when taking on the risk glasses: looking at unexpected credit losses, which is generated by the CPM, two sectors contribute more than 35% to the overall risk, the energy sector alone even more than 20% (see figure 4).
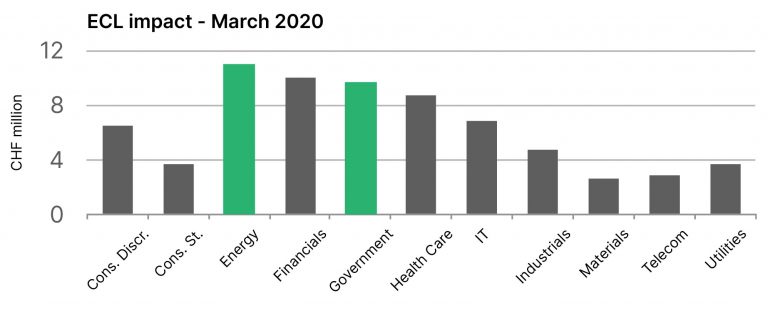
We then calculated the changes in ECL (expected credit loss) by sector between December 2019 and March 2020. The changes in ECL largely correspond to the impact of the COVID-19 crisis on earnings (see figure 5): we see that the same sectors that showed a high risk contribution in December, i.e. the energy and the government sector, carry the highest ECL impact in March.

CPM for reducing earnings volatility
Based on this insight we ask the question how the ECL would have performed if we took the results of our credit portfolio analysis in December and adjusted the portfolio with the aim to reduce unexpected credit losses.
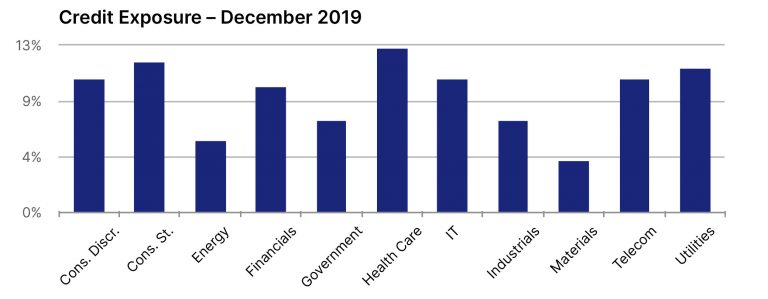
For simplicity we here reduced the exposure on the energy and the government sector substantially: we reduce it by 50% and 25% respectively (a rather unrealistic reduction, but here we want to carve out the key insight only). So the portfolio now looks like in figure 6, and the expected credit losses closely follow the exposure as before (see figure 7).
We now again turn to the risk view and look at the unexpected credit losses of the now adjusted portfolio (see figure 8). One can clearly see that the rather drastic reduction of exposure has also had the desired impact on the unexpected losses: no sector contributes more than 15% to the overall risk anymore.
As before, we then calculated the change in ECL by sector between December 2019 and March 2020 (see figure 9). We see that the mitigating measures have reduced the earnings volatility significantly: with the mitigating measures in place the earnings impact is reduced by CHF 13m corresponding to more than 15%!
Conclusion
Our case study shows that the use of a credit portfolio model facilitates the reduction of earnings volatility. It is the unexpected events that drive this volatility.
The measurement and management of these unexpected events requires the use of a modelling framework that properly accounts for credit migrations and correlations on portfolio level. A credit portfolio model is a natural choice for such a modelling framework: it is actually designed to measure unexpected credit losses on portfolio level. Our case study confirms the applicability of credit portfolio models to the management of earnings volatility.
A key insight is that there is a very clear and natural link between the results of a credit portfolio model and the expected credit losses as calculated in IFRS 9 and CECL models, when both models use the same set of PiT calibration parameters!