SigmaQ Analytics – Practial Insights

Quantitative Credit Risk Management in an Insurance Company
The current pandemic has induced a global economic crisis, adding to the existing challenges of low interest rate environment and the narrowing profitability of insurer’s investment portfolios. And on top of it, many insurers are facing additional uncertainty arising from new accounting rules like IFRS 17 and IFRS 9. These changes have increased the need for portfolio managers to use more timely risk measures and for taking a more advanced Credit Portfolio Management (CPM) view that accounts for changing risk concentrations and correlations in their portfolios Having worked with several insurance companies, our expertise at SigmaQ Analytics lies in advising our clients, from working with cutting edge data management systems to reaping the benefits of the latest developments in quantitative Credit Risk Management in general and CPM in particular.
In the following sections, we discuss opportunities to react to current challenges by embracing the principles of a sound quantitative credit risk management setup and the business applications related to it.
The set up of a quantitative credit risk management system
Phase 1: A data infrastructure ready for today’s needs
In today’s environment the challenges of an appropriate data infrastructure have shifted away from pure capturing and collecting of data in a data warehouse to questions like data connectivity, data accessibility and transformation. While the existence of a state-of-the-art data warehouse must be considered a prerequisite, the setup of API connections will facilitate the availability of it to other internal systems and models, instead of being isolated to one team or department. Today’s needs for an appropriate API integration are similar to the need for setting up of appropriate data warehouses a decade earlier. The use of API is a paradigm shift in the world of data management.
In Figure 1 a typical data setup for the expected credit loss (ECL) calculation under IFRS 9 as well as CECL is shown.
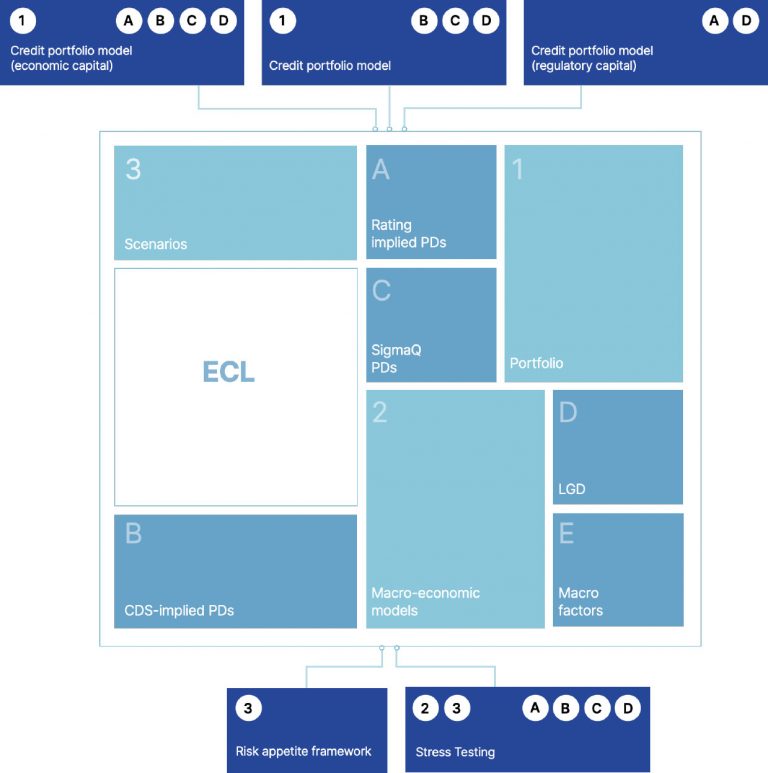
The same data and model components or simple transformations are used by different models. But the important question is how to efficiently organize the connectivity between the systems while keeping maximum flexibility and accessibility? Equally important is also the question of how to cope with different programming languages in the same setup?
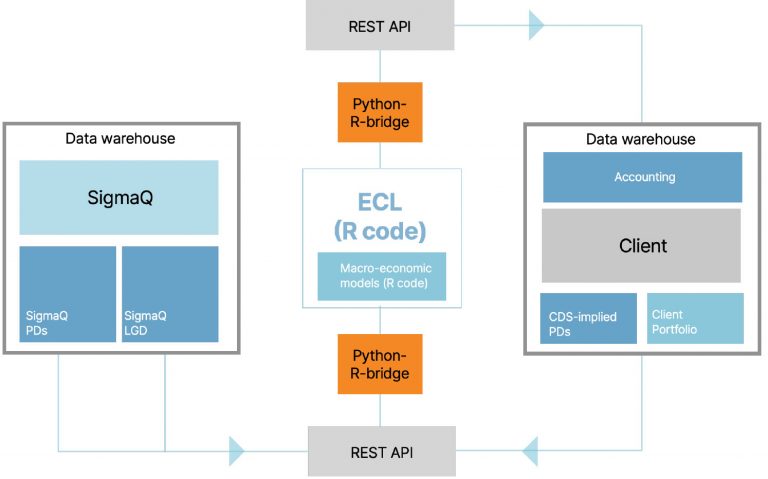
A setup that solves these problems by making use of API connections and a toolbox that makes the overall setup largely agnostic to the programming languages of the underlying models is shown in figures 2 and 3. By using API connections, the exchange of data not just within the organization, but also with the external world can be integrated seamlessly into the overall setup without requiring any downstream models or applications to be modified.
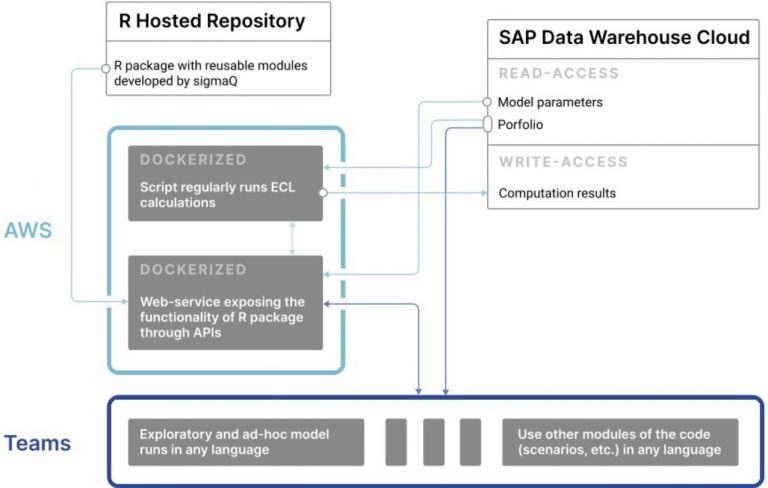
The use of modern API technology does not make databases redundant, but it manages data more productively and overcomes an inefficient and inflexible “linear” setup that was and is used in many institutions.
Our expertise:
Having worked with several insurance clients, SigmaQ’s expertise lies in advising our clients the best way to start the process of developing a modern data management system or to improve the existing one by leveraging the latest developments in digital strategy and API integration.
Phase 2: Risk Quantification
Having the right infrastructure in place, the next step from a risk management perspective is to quantify the risk associated with each exposure and then the portfolio itself. While ratings issued by an agency still might have their validity in the investment process itself, a quantitative modern credit risk management relies on quantities like a probability-of-default (PD) and loss-given-default (LGD) to assess the risk embedded in financial instruments.
The measurement of PDs and LGDs typically in itself is a major task and may not be carried out by insurance companies’ investment division themselves. SigmaQ Analytics provides default probabilities for more than 35’000 corporates globally via a novel statistical Bayesian approach with very high prediction power. We also provide LGDs for more than 100’000 bond issues world-wide.
Credit risk measures from different sources like rating agencies, derived from market CDS spreads or based on statistical models have their own advantages, but our extensive experience working with PDs leads us to conclude that default risk predictions improve when all these measures are used together. Insurance companies are thus well advised to not rely on only one single source for measuring and monitoring credit risk in their portfolio.
Model derived PD term structures are best suited to determine point-in-time (PiT) or through-the-cycle (TTC) PDs. While PiT PDs correspond to the short end of that term structure, TTC PDs can be read off from the long end. Using PiT PDs, portfolio managers can measure the risk as it changes continuously with market development, and decide if they want to keep, sell or hedge some exposures. These PDs change continuously with market conditions and may create unnecessary volatility in the reserves or economic capital. Consequently, for calculating capital reserves, TTC PDs are often preferred as they are more stable compared to PiT PDs.
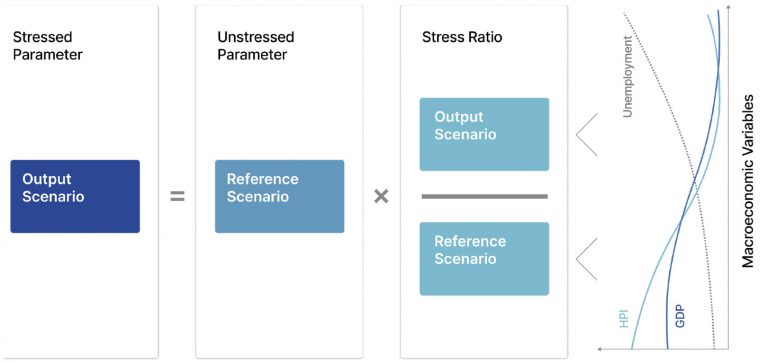
How can insurers benefit from the infrastructure and risk measures? One clear application of this is credit stress testing and scenario analysis. The banking world is well ahead in terms of consistent stress testing since the advent of CCAR regulations in the US, but insurers are quickly catching up on this trend. To perform stress testing, stressed PDs (PDs conditional on macroeconomics scenarios) need to be calculated and this adds another layer of complexity in the modeling process.
Our expertise:
We have implemented PD methodologies for our clients in the banking and insurance space. We have implemented the IFRS 9 ECL model for major insurance companies in Switzerland and have developed models for generating stressed PD conditional on macroeconomic scenarios.
Phase 3: Credit Portfolio Management
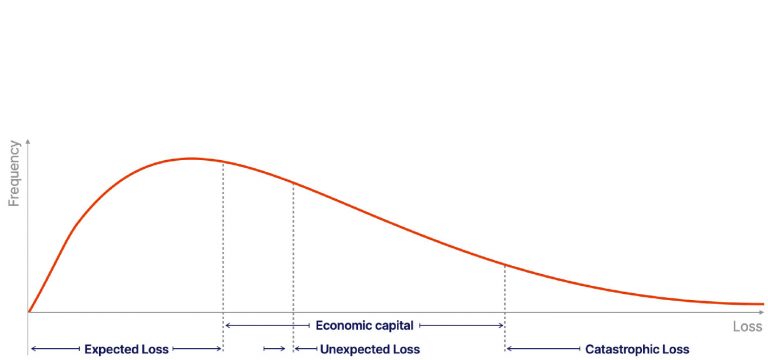
Credit risk needs to be measured and managed not only at transaction level, but also on a portfolio level. A transaction level view is not sufficient to analyse situations where many exposures turn bad at the same time. Portfolio risk concentrations along industry, rating or counterparty dimension also cannot be detected with transaction level analysis. For developing a portfolio view, portfolio values need to be simulated incorporating the exposure concentration and correlations. The output of such simulations generates a loss distribution similar to figure 5 which shows that the loss distribution of credit portfolio is asymmetric with long tails. Large exposure concentration and correlations within a portfolio result in greater unexpected losses and economic capital. The simulated loss distribution provides management with insights on unexpected losses and risk concentrations which would not have been possible using transaction level analysis.
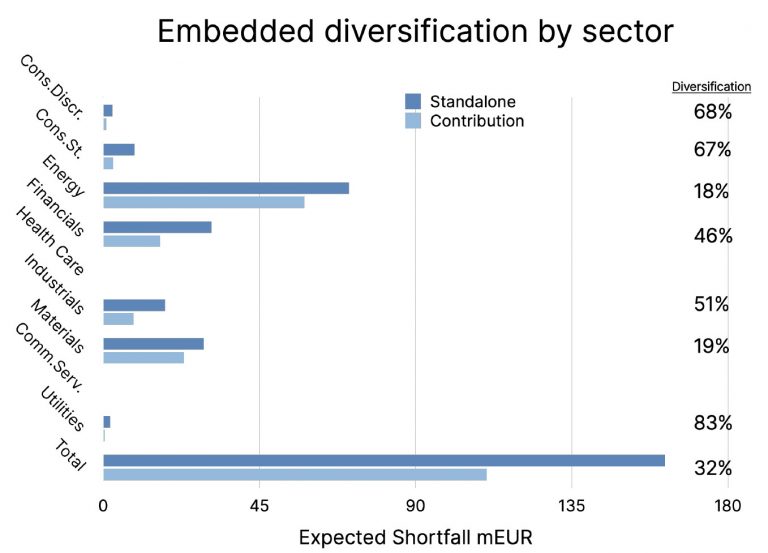
Credit portfolio models have specifically been designed to measure unexpected losses on portfolio level. The important step in setting up a CPM is to develop an asset correlation model that results in correlated credit outcomes. This eventually lets insurers understand and quantify risk concentrations in their investment portfolio. Portfolio effects and concentrations have the potential to affect the performance of an investment portfolio negatively even if each individual transaction within the portfolio may be sound. By incorporating a factor-based approach into the asset correlation model, systematic and idiosyncratic risks are separated from each other, allowing to determine diversification benefits within the portfolio. In figure 6 we show the expected shortfall (tail VaR) on the 99% quantile for various sectors on a standalone basis and on contribution basis, taking the correlation structure into account. From this we can infer the diversification benefit within each sector and the overall portfolio.
The measurement of diversification benefits by risk class and sectors as well as a concentration analysis are mandatory exercises in modern credit portfolio management. This also serves as risk mitigation tool in the sense that it measures the diversification level and allows to measure the effect of portfolio restructurings.
The financial industry has been employing credit portfolio models for over 20 years by now and models have reached a high level of sophistication. While in the past the focus was on measurement of default risk only, nowadays a CPM is expected to be able to calculate both, default and credit migration risks.
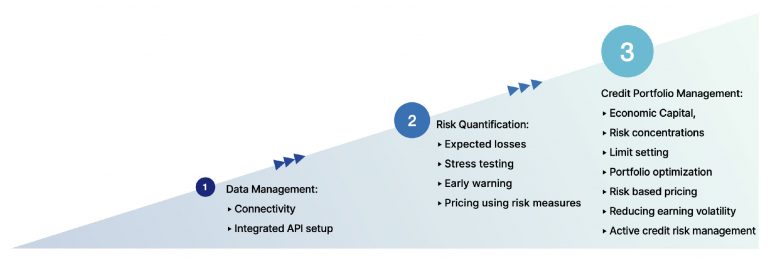
Summarizing the above described three phases, we see an evolving structure that starts with an efficient core data management which is not only able to deliver on state-of-the-art database functionality, but which can also respond to today’s needs of increased data connectivity and accessibility. From there a quantitative risk assessment can be set up that works on position or single counterparty/obligor level and delivers on critical tasks like expected loss calculations, credit stress testing and developing early warning systems. The true management functionalities come in through using a credit portfolio management, which opens up a portfolio view and a more holistic understanding of credit portfolios (see figure 7).
Our expertise:
Over the years, we have implemented several credit portfolio models for insurance companies, banks and energy traders. We have extensive combined experience in developing credit risk models and advising clients on the best practices associated with use of these models.
Some business applications
We at SigmaQ Analytics have advised and helped our clients develop the following business applications, for which a quantitative credit risk management as described above is a prerequisite.
a) Early warning and reporting system
The PDs are forward-looking indicators of credit quality, and a deterioration in these figures over time (above a user-specified threshold) is a red flag needing further investigation.
b) Current expected credit loss (IFRS 9/CECL)
Financial institutions are now expected to calculate and report lifetime losses of all exposures held at amortization cost.
c) Credit economic Capital Estimation and its Allocation:
Besides computing regulatory capital, the more advanced insurers have been calculating credit economic capital for their risk management purposes.
d) Risk Concentration Detection and Reporting
Estimate risk concentration in portfolio at region, industry and name level, accounting for exposure concentration and correlation specific to an insurer’s investment portfolio.
e) Limit Setting
Currently some insurers set limits based on exposure amounts or ratings, and these do not account for risk concentration and correlations in their portfolios. A good limit setting system should incorporate portfolio risk in limit setting.
f) Stress testing and strategic asset allocation
Stress testing allows insurers to explore how their portfolio would perform under different macroeconomic scenarios. Stress testing can also be used for strategic asset allocation and for portfolio construction to compliment portfolio strategy.
g) Portfolio optimization
Using risk-return analysis, portfolio managers can explore which exposures from a list of possible alternatives will improve their portfolio risk-return. While an insurance company may not be able to change its portfolio in the short term, it can work to optimize it over time.
h) Managing earnings volatility
By constructing or changing existing portfolios using the risk measures described earlier, insurers can decrease earning volatility in their portfolios.
SigmaQ Analytics Expertise
Data service:
We have developed a public company PD model, incorporating publicly available data on 30,000 plus public companies, that estimates the term structure (1-5 years) of PD. Using the data, we have calculated both PIT and TTC PDs. Besides measuring PDs, our model produces probabilities of default that are conditional on macroeconomic scenarios. The user can input their own macroeconomic scenarios and estimate issuer/company level PDs for that particular scenario.
Models:
We have also developed a CPM model that generates portfolio value and loss distribution incorporating the underlying asset correlations. The loss distribution can then be used to calculate economic capital/credit Value-at-Risk (VaR), which is aligned to insurers’ risk appetite or regulatory requirement.
Advisory:
We have helped our clients develop a credit risk management system and perform stress testing, as well as assisted in strategic asset allocation and optimization of their portfolio risk return.
SigmaQ Analytics is a boutique consulting firm specializing in credit risk management and data analytics for insurance companies in Europe and the US. Our core team consists of seasoned credit risk professionals, who have years of experience working with both large multinational and medium-sized insurance companies, as well as data scientists who are working with both traditional statistical methods and AI/ML methods to solve business problems.