The transition to
Net-Zero

Quantifying emission-ajdusted PDs
Need to know
With COP27 currently underway we are reminded that the transition to Net-Zero is one of the most pressing problems of today’s societal and business activities. Far-reaching agreements and initiatives have been launched to make this transition a reality. Financial institutions also play a central role in this process. While the exact implementation is still hotly debated, especially also in the context of ESG, it is clear that a successful pproach must be data-driven, transparent and objectively quantifiable.
One important parameter affected by the transition is the likelihood that companies will not be able to meet their debt obligations. Appropriate models are needed to quantify the impact of emissions on this credit default risk.
SigmaQ’s corporate default risk technology
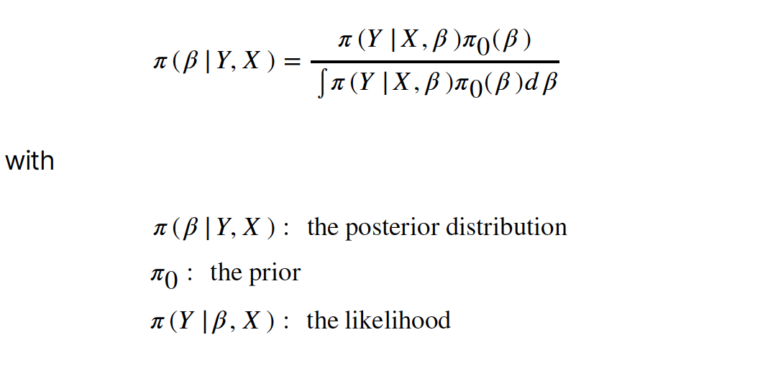
SigmaQ Analytics has developed a novel approach to quantifying corporate default risk that allows new risk factors, such as GHG emissions, to be incorporated into the model even when the underlying risk factors have historical time series data of significantly different lengths. This approach builds on latest data science methods and Bayesian updating. In its core it uses company financials and market-based data (together the explanatory variables X) to calibrate so-called Bayesian logistic regressions for the default variable Y:

The explanatory variables of the model are quantities like the firm’s profitability, liquidity, valuation, size, volatility, leverage and performance. Our “standard” default probabilities (PD), derived using this approach, are consistent with those of other wellknown vendors.
Emission-adjusted default probabilities
To model emission-adjusted default probabilities, we add the emission risk factor to the model. We do not use ESG ratings or other qualitative input, but rely on reported emission data only. The emission risk factor is normalised with respect to revenues (“emission intensity”). It is fully integrated into our corporate credit default risk model, which is used to generate the“standard” PDs mentioned above. This means that the impact of emissions can be observed within the same fully calibrated model.
We have already recalibrated the model with the emission risk factor integrated three times in the last two years. With each recalibration, the impact of emissions on corporate default risk has increased due to more and better data. Although this signal is still weak, it should become stronger over time as more and more companies provide emission data. More traditional approaches to credit risk will not be able to quantify this signal within a consistent and purely quantitative framework.
The impact: some real-world examples
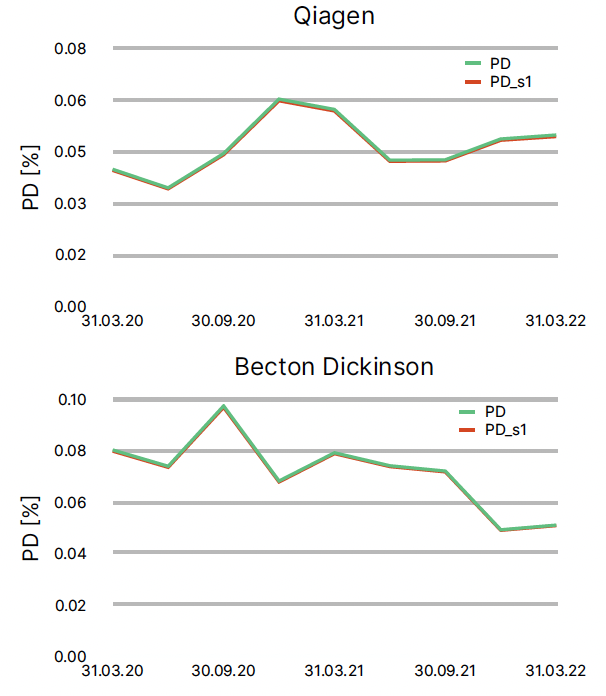
By comparing default probabilities with and without the emission factor, credit officers and analysts can observe the impact of adding it when selecting companies in their portfolio. Looking at real-world examples one can understand better how PDs change when adding the emission factor. We start with two companies from the health care industry, Qiagen and Becton Dickinson. Qiagen and Becton Dickinson have reported the following emissions in 2021:

Qiagen reported revenues of $2.2 bn and Becton Dickinson revenues of $20 bn. This results in similar scope 1 emission intensities. The two charts below show the standard PD and the scope 1 emission-adjusted PD for the two companies:

In both cases they are almost indistinguishable. The reason for this is clearly that the emission intensity of these two companies is simply too low to have a significant impact on PD.
But what about companies that are perceived as real polluters then, for example companies from the oil & gas sector? Let’s look at two such companies: Chevron and Phillips 66. The reported emissions are:

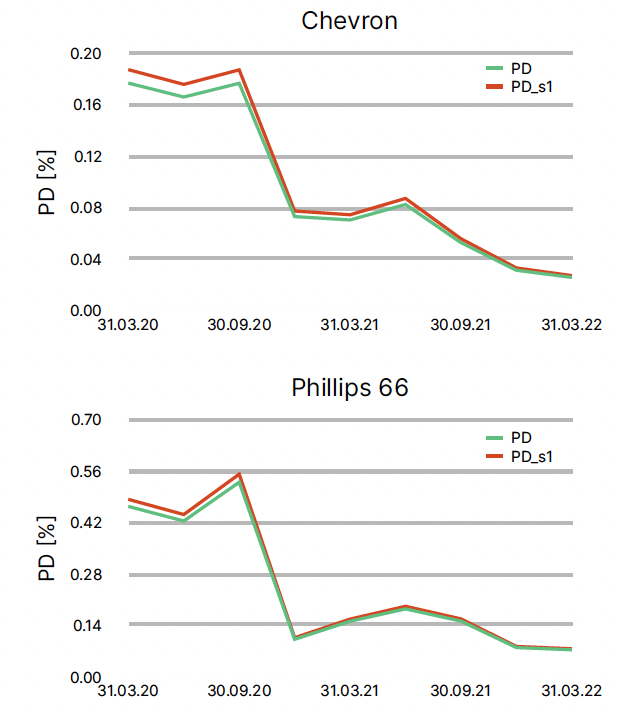
The two companies reported revenues of $162 bn and $115 bn respectively. First of all, this leads to significantly higher emission intensities than in our previous example. Moreover, the emission intensities of the two companies are not so close in this case. Therefore, in this example we should expect a) a real impact on PDs and b) a different impact for the two companies. This is fully confirmed by our model results, which are shown in the graphs below.

For Chevron the impact of emissions on PDs is around 6%, and for Phillips66 3%.
The increased emission-adjusted PDs for the oil & gas companies are clearly in line with our expectations. How does this compare to companies in other sectors with less obvious impacts? Let’s look at Levi Strauss and AMD. Levi Strauss is a textile company and AMD is from the semiconductor industry. The reported emission figures are as follows:

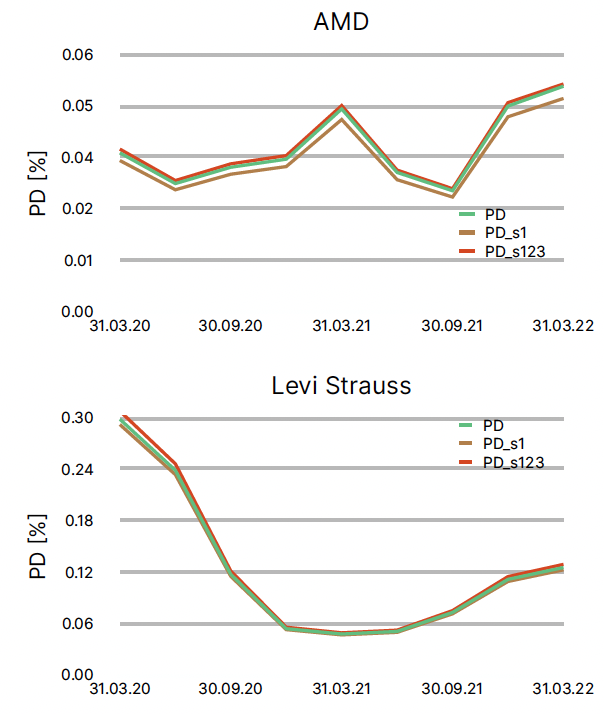
The reported revenues are $5.7 bn and $4.1 bn respectively. First of all, we observe that these companies have low scope 1 and comparably very high scope 123 emissions: their carbon footprint comes mainly from indirect emissions due to their supply chain and company-operated facilities. In both cases, this leads to a situation where the scope 1 emission-adjusted PDs are lower than the standard PDs, and just the opposite for the scope 123 emission-adjusted PDs.

The impac for scope 1 emissions is around -5% for AMD and -2% for Levi Strauss, while it is +2% resp. +3% for scope 123 emissions.
These few examples show that our fully calibrated model provides discriminatory power between companies within the same sector, across sectors and also in terms of direct and indirect emissions. Even though the general data situation on emissions and especially on scope 3 still needs to improve greatly, our model shows that objective and transparent impacts of emissions can already be quantified with a consistently calibrated model.
Our services and products
SigmaQ Analytics’ novel credit default risk technology provides both standard and emission-adjusted default probabilities. The respective coverages are around 35’000/8’000 companies worldwide. Contact us if you are interested to learn more about our approach or a benchmark analysis of your own results.
