SigmaQ
Corporate Default Risk Technology

Dispersion in Global Credit Markets: What Credit Ratings Don't Tell You
SigmaQ Analytics – Europe’s Independent Source for Large-Scale Default Probabilities
What Credit Ratings Don’t Tell You
When investors compare two BBB-rated companies, they often assume their credit risk is broadly similar.
Our analysis suggests otherwise.
Using SigmaQ’s unique corporate default risk technology, we examined close to 2’300 rated listed companies worldwide and compared their probabilities-of-default (PDs) with traditional rating categories.
The results are reassuring at first glance: average PDs align closely with the expected rating hierarchy. Higher-rated firms exhibit lower default risk, while speculative-grade issuers display higher risk levels.
But averages tell only part of the story.
A Real-Time View of Risk
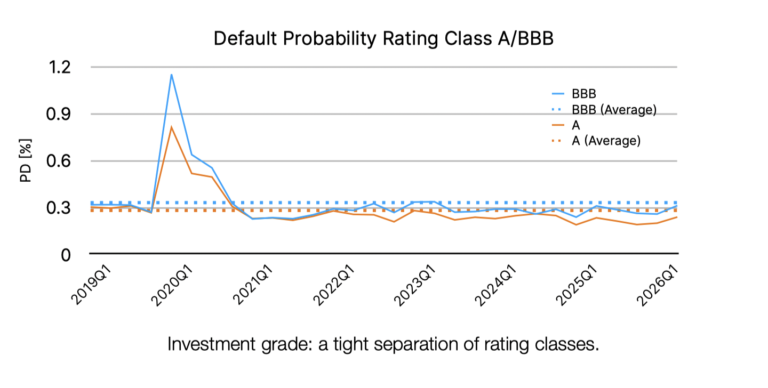
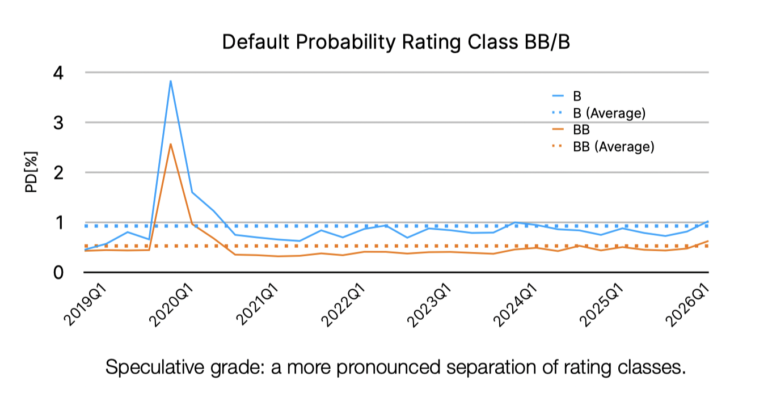
Our analysis covers the period from 2019 through 2026, including the COVID-19 crisis. When we analyze default probabilities grouped by rating class, long-term averages (2019–2026) confirm the expected risk hierarchy:
• There is a clear separation between rating classes.
• For investment-grade issuers A and BBB, default probabilities are relatively tightly clustered.
• For speculative-grade issuers (BB and B), however, the dispersion increases markedly.
• COVID-19 stress test: Our model captured the spike in default risk in real time, with peaks ranking perfectly by rating class.
It should be noted that our methodology relies exclusively on observable information:
• Financial statement data
• Equity market prices
No subjective overlays. No committee adjustments. No black boxes.
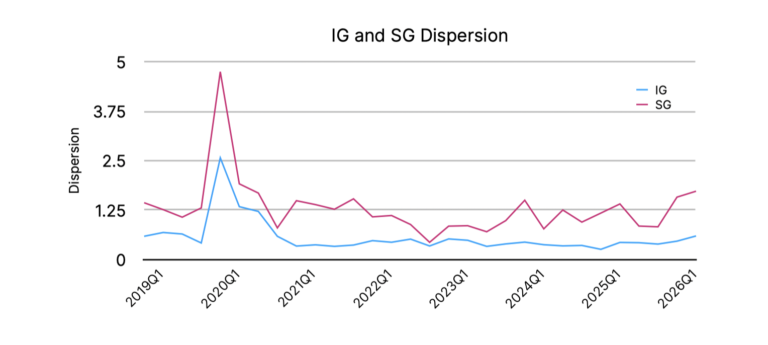
The Hidden Dispersion Within Rating Classes: Europe vs. the US
When examining the distribution of PDs within the investment-grade (A/BBB) and speculative-grade (BB/B) bucket, we find that the dispersion in the SG bucket is considerably higher than in the IG bucket:
• The dispersion increases with lower ratings: BB and B classes exhibit wider PD ranges than A and BBB. This can partially also be attributed to the higher PD levels as such.
• Substantial overlap exists between IG and SG rating classes.
• This implies that some speculative-grade companies exhibit PDs comparable to investment-grade firms.
• Conversely, some investment-grade issuers display risk profiles more commonly associated with lower rating categories.
We can analyse this further by breaking down the dispersion by geography.
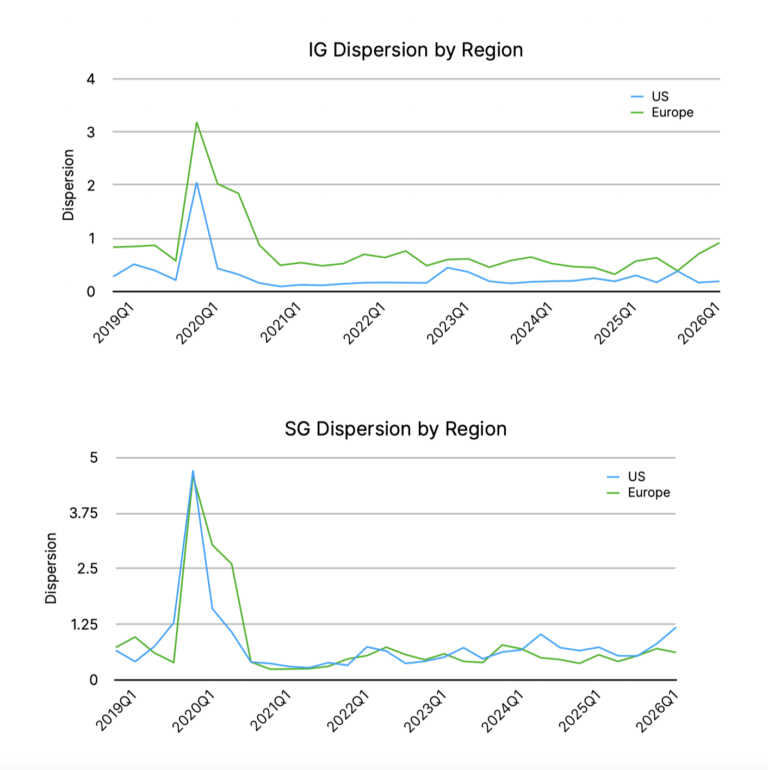
For investment-grade issuers, we observe significantly greater dispersion among European companies than among their US peers. In speculative-grade categories, however, this distinction largely disappears.
The reasons behind this pattern remains unclear to us. It may reflect structural differences in credit markets, sector composition, or the way rating categories capture risk across regions.
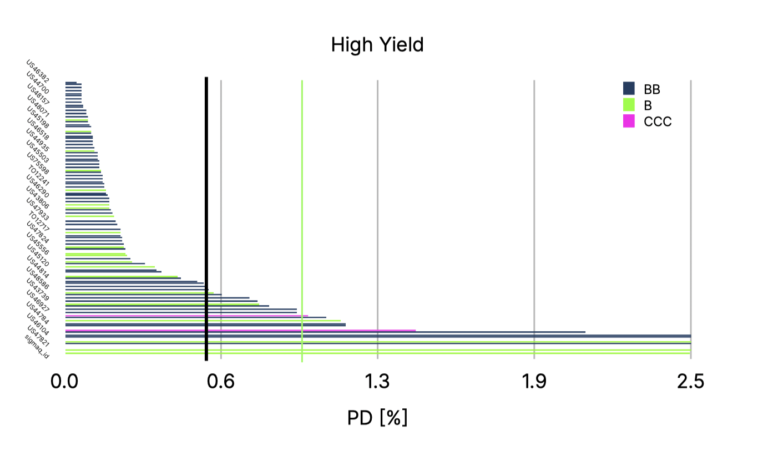
High Yield Portfolios
To illustrate the practical implications, we analyzed 100 speculative-grade firms in our dataset. Comparing their SigmaQ PDs to the long-term averages for BB/B classes mentioned above:
• A significant subset of SG-rated firms exhibited PDs more typical of IG issuers.
• This suggests that rating classes alone may not fully capture underlying risk differences, particularly for portfolios where granular risk assessment is critical.
Why This Matters
For portfolio managers and credit analysts, these findings have practical consequences.
If companies within the same rating class exhibit meaningfully different default probabilities, then:
• Portfolio risk may be more concentrated than ratings suggest.
• Relative value opportunities may exist within rating buckets.
• Monitoring risk through ratings alone may miss important developments.
Forward-looking, granular default probabilities provide an additional layer of information that can help investors distinguish between companies that appear similar on paper.
About SigmaQ’s Default Risk Technology
At SigmaQ, we measure default probabilities for 35’000+ companies across 70+ markets using Bayesian machine learning applied to observable balance sheet data and stock prices. Our approach allows you to take advantage of modern AI-driven modelling techniques while maintaining full explainability. No black boxes. No subjective adjustments. Just transparent, data-driven risk insights calibrated on 50+ years of history, including 2M+ observations and 3,000+ corporate defaults.
Please visit our website www.sigmaqanalytics.com for more details or contact us at contact@sigmaqanalytics.com.