SigmaQ Energy Risk Solutions

Liquidity risk management and potential future collateral: Introducing a new concept to energy trading
SigmaQ Analytics is introducing a new concept to energy trading: the potential future collateral (PFC). Most readers familiar with concepts in credit risk for derivatives trading are familiar with the concept of the so-called potential future exposure (PFE), an indispensable element of modern credit risk management for derivative books. In light of last year’s events in energy markets, SigmaQ Analytics has identified the urgent need for a concept that measures forward liquidity risks in energy trading, like the PFE is measuring forward credit risks.
The founder of SigmaQ Analytics, Kai Schnee, together with Kai Pohl, Head of Energy Risk Solutions at SigmaQ and former Head of Centrica’s Energy Trading Risk Department, presented this concept for the first time to the market during last month’s EFET working group in Essen, Germany.
The PFC and its underlying new integrated energy risk model could change the way energy trading companies manage risk in important ways. At its core, this new model is about enabling energy trading companies to better manage their forward liquidity needs and credit risks from within the same model. SigmaQ’s approach overcomes the shortcomings of traditional approaches, which are usually simply adopted from those in banks. We believe that these approaches are dangerously short-sighted when applied to energy trading without taking into account its specificities.
The concept
Potential future collateral (PFC) is different from current collateral in that it represents a range or distribution of outcomes rather than a single point estimate. Like PFE is used as input to credit risk calculations, the PFC forms the basis of liquidity risk calculations. It requires underlying (stochastic) commodity forward prices, a full trade repository including pricing models, collateral and netting agreement information.
Introducing the PFC is connected to a novel modelling approach for energy trading risk management itself, which merges concepts from trading risk management and those from loan books:

Such an approach is tailored to the needs of energy trading, because it addresses critical characteristics of energy trading:
‣ Highly volatile energy price dynamics with pronounced peaks.
‣ Extreme risk dynamics and unexpected high collateral requirements.
‣ Significant concentrations on sectors and underlyings.
‣ Long-term, non-collateralised production/consumption side/asymmetric collateralization.
‣ Varying liquidity on maturity buckets and limited ability to hedge the full curve.
‣ Substantial wrong-and right way risks.
Applications
The best way to demonstrate the power of our approach and the insights that a PFC can deliver to energy trading companies is via a simple toy portfolio. Our stylised portfolio shows asymmetric collateralization: the energy bought from a producer is uncollateralised, while the energy sold in the market is collateralised. We assume that all trades are done with different counterparties. We assume an overall sold (bought) energy of an amount of EUR 370 million.
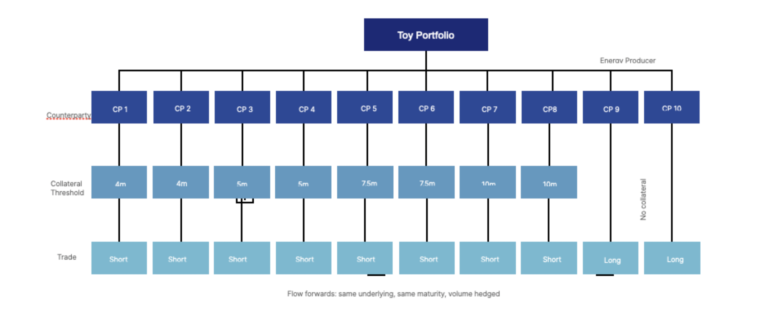
• The two long forwards are entered into at discounts of 10% and 12% to current market price.
• The 8 short forwards are entered into at lower discounts, staggered from 10% to ATM. The portfolio thus is profitable from the beginning.
• We analyse the PFC at T_0 and at a later time point T_1, for which we assume the market prices to have risen by 30%.
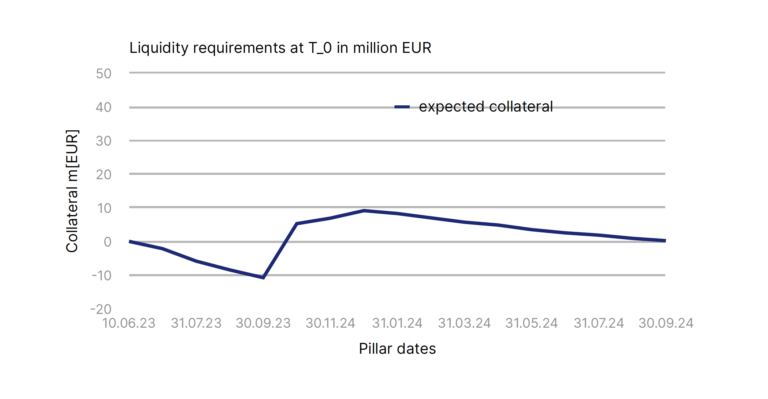
We first analyse the situation at T_0 and the collateral requirements over the 8 short trades over their entire lifetime. The current collateral of the portfolio basically is zero with the given forwards prices and collateral thresholds. So from liquidity perspective a very relaxed situation at time T_0. Also the expected future collateral over the lifetime of the trades, which can be calculated easily from the forward curve, is rather modest on the overall volume of EUR 370 million sold: liquidity requirements are at no point more than EUR 10 million (shown in the figure below).
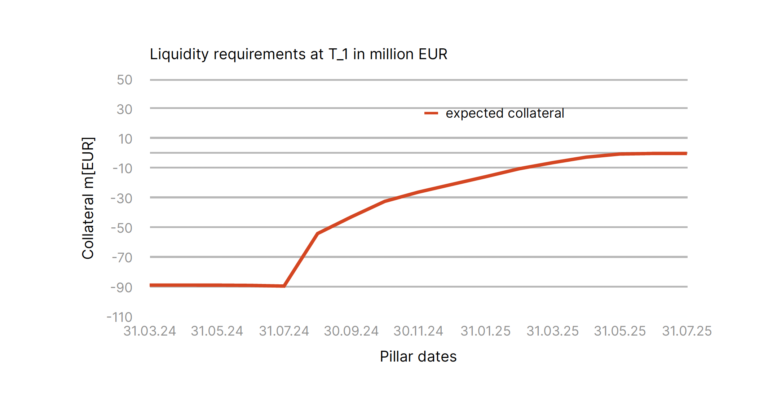
Now we look at the same portfolio at time T_1, where we assume that market prices have risen by 30%. Looking at the same quantities as before we now see that the liquidity requirements have changed substantially: from before EUR 10 million to now EUR 90 million, i.e. an increase of 900%.
If the collateral was symmetric, the long trades would have generated now an offsetting collateral to be posted by the energy producers. This not being the case, the liquidity requirements now have basically exploded as shown in the figure below.
The question must be asked if this substantial increase of liquidity requirements could have been foreseen in any way? A question vital for energy trading companies as we have seen during last year’s energy crisis.
So we analyse again the situation at T_0, but now with the help of SigmaQ’s energyTradingMLC model, which among others calculates the PFC not only on the level of counterparties, but also for the entire portfolio based on consistent future scenarios rather than simply off the forward curve (i.e. using a fully calibrated stochastic commodity forward model).
We determine the collateral requirements of the portfolio at T_0 including quantiles of the PFC. The result is shown in the figure below (negative collateral is collateral to be posted, so the 5% quantile is the quantity to look at from liquidity perspective):
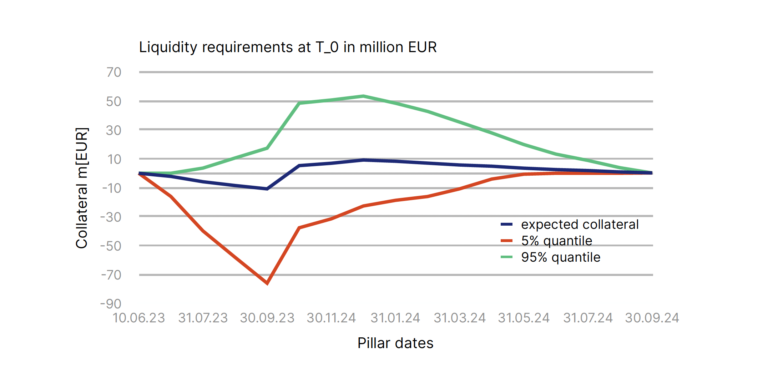
According to this analysis, the liquidity requirements could become close to EUR 80 million at the peak over the lifetime of the trades on the 5% quantile. This level of liquidity requirements basically corresponds to that one of the portfolio in T_1 as we have just seen before, i.e. a level that has realized in the market scenario of 30% increasing prices.

Having learned from the example before that the calculation of the PFC can save us from unexpected collateral requirements on portfolio level in extreme market scenarios, we can ask ourselves the same question at T_1 now again: what is to be expected in just another extreme market scenario? The answer is simple when looking again at the PFC 5% quantile in the graphic below: another increase of more than EUR 100m will happen if the market continues to move up sharply as before.
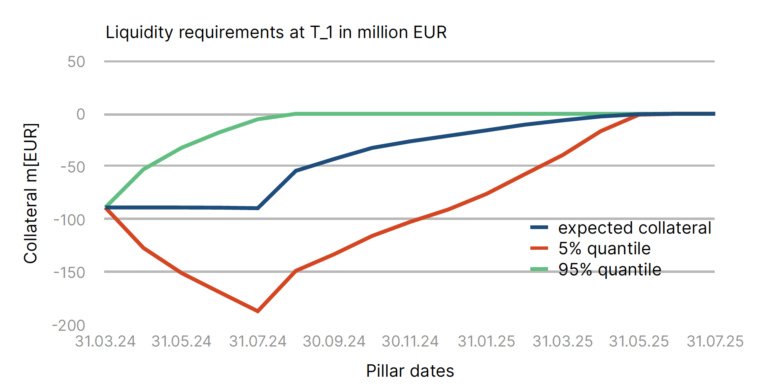
The liquidity requirements would thus have gone up by 1800% from EUR 10 million to EUR 180 million in two unexpectedly sharp market price increases of 30%. A situation that can still be considered mild compared to what happened in reality last year, but already a potentially life-threatening event for companies that are not prepared for such events because they don’t have any realistic view of forward liquidity requirements in unexpected market scenarios.
Within the same model we can also determine the PFE for our toy portfolio, which is the basis for credit risk calculations: our energyTradingMLC model calculates CVA and C-VaR (credit risk value-at-risk) within the same model. The figures below show the PFE for T_0 and T_1.
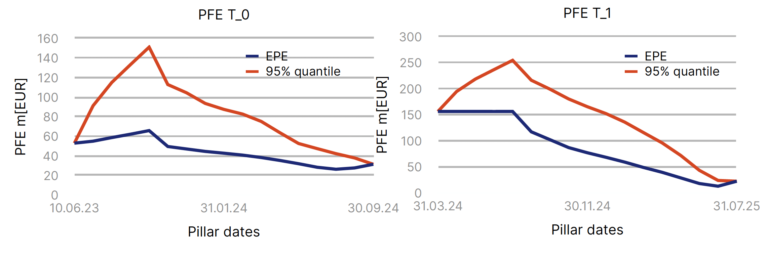
The increased liquidity requirements thus do not imply that the credit risk is reduced in T_1 wrt to T_0 as one might have simplistically expected on first sight. The PFE calculation shows that the actual credit risk exposure even increased substantially.
The reason for this is once again the asymmetric collateral situation: the two long trades with the energy producer are not collateralised and produce a high exposure when deep ITM.